Sustainability to Sustain your Business (and our Planet)
In response to escalating concerns about climate change and social equity, a growing number of jurisdictions (most recently California and the European Union) have enacted E.S.G. (Environmental, Social, Governance) disclosure requirements for businesses, where “E”, “S” and “G” represent categories of financial and non-financial metrics that measure the sustainability performance of a business.
While no one likes to have to follow more rules, most people agree that something needs to be done quickly to mitigate these problems and that there is no better driver of innovation and change than the entrepreneurial spirit. These sustainability regulations are governments’ way of nudging that spirit in the direction we should all be going in anyway.
Ultimately adding sustainability to the conversation benefits businesses in several ways:
- By uncovering data points that have always been material to the business but overlooked
- Then using that data to improve risk management, and find business opportunity
- Demonstrating commitment to sustainability has been shown to attract customers as well as talent
The process of preparing to report on sustainability metrics begins with a materiality assessment, which involves gathering information from internal and external stakeholders about issues that they see as important to the business, and then going through a mapping and prioritization exercise. The goal is to identify primary focus areas for your sustainability programs.
Examples of Sustainability Data as Business Data
For example, identifying Diversity, Equity & Inclusion (DEI) as a material issue can lead to a focus on Employee Turnover rates, which is a metric in the “S” category. In the retail industry where employee turnover is sometimes as high as 75%, a mere 10% reduction in employee turnover can improve the bottom line by 5 – 7% not to mention the qualitative benefits of having more engaged employees.
Similarly, looking more closely at waste management and reduction impacts waste disposal costs and reduces greenhouse gas emissions, but can also drive innovation in whole-product life cycle design. Constraints are well-known triggers of creativity, as any fan of the Iron Chef cooking show is aware!
Examples of risk management uses of sustainability metrics include impacts of extreme weather events on a company’s physical assets (do you have property in a place prone to floods or forest fires?), and market impacts due to changing demographics (how will a decrease in births impact a company that makes diapers?).
And to illustrate the PR benefit, we know from personal experience as well as academic studies, that products labeled “sustainable” or “organic” are the drivers of sales growth in many sectors.
The good news is that many business leaders around the world recognize all this, as evidenced by a survey of 3,000 global CEOs who say that they expect investment in sustainability programs will bring business benefits within the next 5 years. Meanwhile in the same survey 44% cite inability to get insights from data as the biggest risk to realizing these goals, the second highest grouping.
Don’t Make it Harder than it is
Data challenges – and this is true of all business data used for planning, analysis and reporting including sustainability data – are consistently named as the biggest impediment to progress. On the one hand society (and companies) are generating more data than ever before in history, by enormous orders of magnitude. With data being the “fuel” to drive the purported AI revolution, this is sometimes hyped up and compared to the oil boom of the twentieth century. In reality, data challenges are exacerbated by two common misconceptions:
- Under-estimation of the effort involved, thanks to an over-optimistic perception of what technology can do, or
- Over-estimation of the effort involved, thanks to a combination of an unbounded vision and (perhaps) trauma caused by earlier under-estimation
Five Recommendations
Fortunately, significant progress is possible between these two extremes, once the following principles are embraced:
- Lean into materiality and the 80/20 rule to set priorities for where to start.
- Both technology and human engagement are required, so plan your resources accordingly.
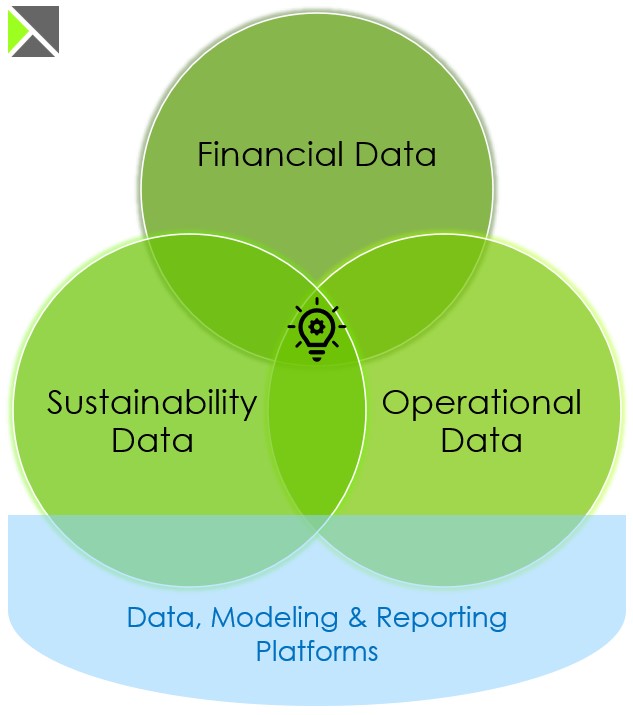
- Understand that the segmentation between “sustainability” data and other business data, including financial data, is somewhat artificial. While it is important to be intentional about what data you choose to collect and use, you do not need to invest in different technology systems to manage and store them all.
- Focus on designing a technology foundation to support an on-going business process, rather than thinking in terms of a “one-and-done” solution because there will always be new data sources and priorities.
- Assess your existing data landscape and technology investments before shopping for a new solution. You may ultimately benefit from buying a new piece of software specifically for E.S.G. Reporting, but you likely already own tools that can help with the necessary pre-work of collecting, cleansing, mapping and transforming data from a variety of data sources.
Summary
It is a difficult task to figure out how to collect, cleanse, and manage sustainability data efficiently while ensuring quality, and auditability. Recognizing that sustainability data including Scope 1, Scope 2 and Scope 3 emissions data, waste data, packaging data, and demographic data, are just other forms of business data opens the door to simplification by using technology that you already own and have expertise in such as the software you use for financial planning & analysis (FP&A), while also laying foundations for building integrated models for analysis, forecasting and more.
Staying with familiar technologies frees up time and resources to focus on that which is new and difficult and allows you to make progress while deferring bigger technology decisions, for example whether a new specialized ESG reporting solution is warranted.
Going through the process of understanding your data landscape prior to making an expensive new investment will educate you and help inform the buying process.